The Day I Realized Most Reviews Were Just Fancy Guesswork
I used to work in a lab that had thermal chambers the size of walk-in freezers, battery cyclers that ran for weeks, and drop towers that could simulate a phone falling out of a second-story window. We generated numbers that actually meant something. Then I left, started reading consumer reviews, and realized a lot of them were still relying on “feels like all-day battery” and “screen looks bright outside.”
That is not testing. That is vibes with better lighting.
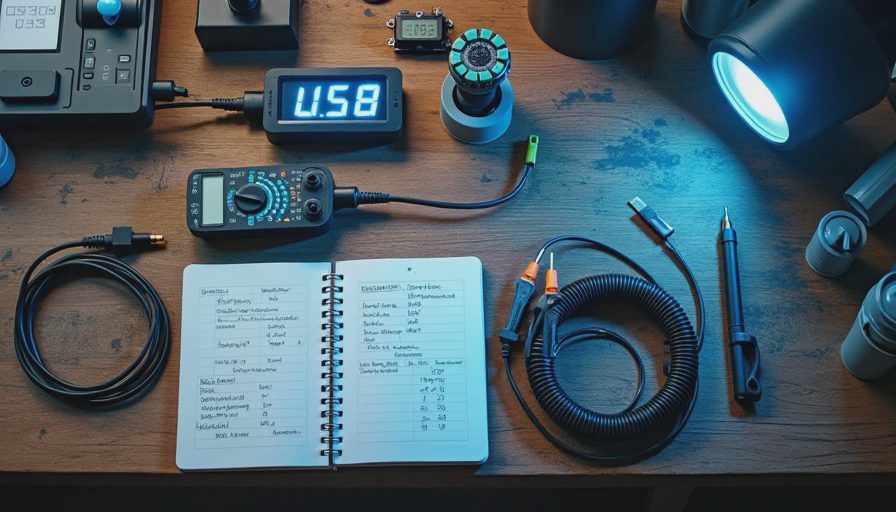
So I built a small, repeatable rig that lives on a workbench in my Reno garage. Total cost: just under $200. It does not replace a corporate lab. It does something more useful for the rest of us: it forces honest, comparable numbers instead of marketing-friendly impressions. Every long-term review on this site starts here.
What the Rig Actually Does
The goal is simple. Measure the same things the same way, every time, so a reader can compare a $300 phone to a $1,200 phone without wondering whether different reviewers just had different moods that day.
Core capabilities:
Controlled battery drain under mixed real-world use
Outdoor-relevant screen brightness and visibility checks
Basic ANC performance in repeatable noise environments
Quick mechanical abuse (controlled drops and flex checks)
Consistent audio latency and call-quality reference tracks
Nothing exotic. Just the tests that actually predict whether you will still like the device after week three.
The Exact Parts List (Under $200)
Here is the current shopping list. Prices fluctuate, but this configuration has stayed under two hundred dollars for the last year.
USB power meter + data logger (the kind that records voltage, current, and cumulative mAh) — ~$35
Adjustable LED panel with measured lux output and a cheap light meter app calibration — ~$40
Small Bluetooth speaker + pink-noise and airplane-cabin reference tracks on a loop — ~$25
Phone mount + tripod that locks at consistent angles for brightness and camera tests — ~$20
1-meter drop tube (PVC with foam padding at the bottom) and a digital angle finder — ~$30
Multimeter, spare cables, and a cheap thermal camera attachment for spotting hot spots — ~$40
Notebook and a simple spreadsheet template that forces me to log every run the same way
That is the whole rig. No custom CNC parts. No sponsorship stickers. Just tools that force consistency.
How I Run a Battery Test (The Part Most Reviews Skip)
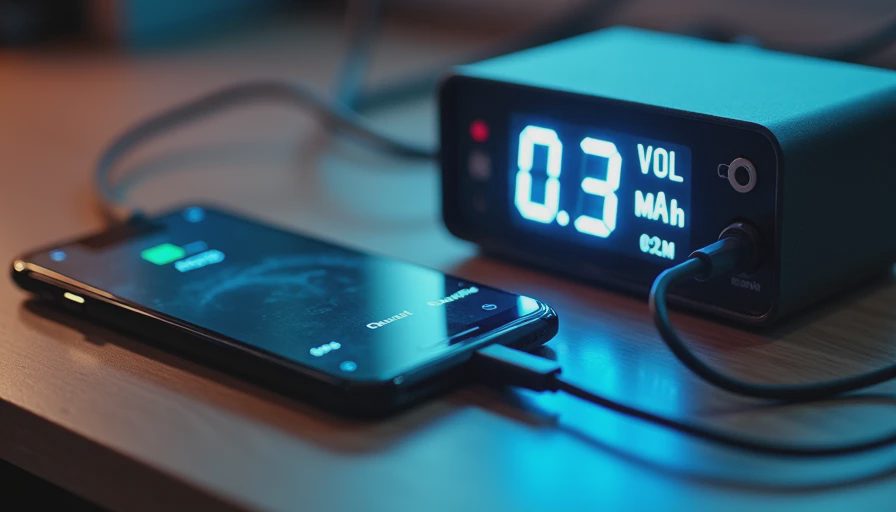
Marketing numbers almost always use idealized conditions: airplane mode, 150 nits, almost no radios. Real life is messier. My standard mixed-use cycle looks like this:
Charge to 100 % and let the device sit for 30 minutes.
Set brightness to a fixed 400 nits (measured, not “auto”).
Run a 90-minute loop: 20 minutes social scrolling, 20 minutes video streaming at 1080p, 15 minutes navigation with GPS and mobile data, 15 minutes music with Bluetooth, 20 minutes standby with notifications.
Log the exact mAh used and the percentage drop.
Repeat the cycle until the device hits 20 %.
Three full runs minimum. Average the results. If the numbers jump around more than 5 %, something is wrong with the setup or the device is thermal-throttling and I note it.
This is not glamorous. It is, however, the difference between “all-day battery” and “you will be hunting for a charger by 4 p.m. if you actually use the thing.”
Screen Brightness the Way Your Eyes Care About It
Peak nits on a pure white screen for three seconds is a marketing number. What matters is whether you can read a map at noon on a sunny trail or see the notification shade when the phone is in your hand outdoors.
I take the device outside at roughly the same time of day, hold it at a fixed angle, and measure both the display output and the ambient light. Then I note the lowest brightness setting that remains comfortably readable. That single number has killed more “brightest screen” claims than any lab graph.
ANC and Latency Without the Fancy Chamber
I do not own an anechoic chamber. I do own a consistent playlist of reference noise: airplane cabin, open office, city street, and a crying toddler track (thank you, internet). I play them at the same volume through the same speaker, seated in the same chair, and score how much of the noise remains and whether voices stay intelligible. It is crude. It is also more predictive of real annoyance than a single laboratory attenuation curve.
Latency gets the same treatment: a fixed video clip with a sharp clap or drum hit, recorded on a second device so I can measure the gap. Numbers under 40 ms feel instant. Numbers over 120 ms start to feel like a bad video call. I write the actual millisecond range, not “low latency.”
Why Every Independent Reviewer Should Steal This Idea
You do not need a Best Buy lab. You need a system that stops you from lying to yourself. When the same phone produces the same battery curve three times in a row, the review writes itself. When the curve falls apart after week two, that becomes the story instead of a buried caveat.
The rig also keeps me honest with readers. I can show the method. You can decide whether my use case matches yours. That is the entire point of this site.
Spec sheets are free. Truth takes a few weeks—and a workbench that costs less than most flagship phones.
Next up I will dig into why those outdoor brightness numbers matter more than the ones on the box, and how manufacturers keep getting away with the gap. The rig will be busy.




No letters yet — be the first to write.